
Image Analysis
The PAX-it Image Analysis Software Module includes all the features of the Basic Measurement Module, while adding an additional level of capability. Rather than drawing measurements on an image, the image analysis tools automatically detect objects, layers, areas fractions, or optical profiles for data collection.
Flexible Routines for Photo Analysis
PAX-it image analysis software is built flexible, allowing the user to define the specifics of the analysis in an understandable wizard format. No degree in computer science is required for these easy-to-use functions! Once analysis routines are defined, they may be saved as a stored routine, and applied to other images with the click of a button.
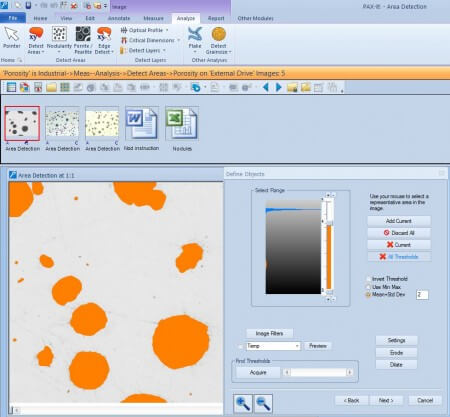
Materials Science labs will benefit from specific routines included in the image analysis package, such as coating thickness detection, porosity analysis, nodularity analysis, ferrite-pearlite calculations, grainsizing, flake size distribution, and more. Specify any of these analyses according to your lab’s needs, and even design your own routine for area fractions or detection of objects via thresholding, to customize your data collection and reporting.
Automatically Analyze Your Images
PAX-it! Image Analysis tools can use density, color, shape factors, and size filters to detect and sort objects or areas within your images. Filters may be applied to disregard objects of certain shapes or sizes, or to split the results into bins related to specific measurements.
Sort, Store, and Share your Data
All image measurements are displayed on-screen in an easy to read table, with summary statistics and graphs also available for display. The image analysis data can be exported directly to Microsoft Word®, or Excel® using PAX-it Report Generation. Report templates are customizable, allowing results to be displayed in a variety of ways including tables, summary stats, graphs, and more. By incorporating the annotated image or images into the report, including an indication on the image as to where the measurements were taken, the reader has a full picture of the process.
PAX-it!’s intelligent software, combined with easy-to-use wizards and re-usable saved settings, increase productivity and help eliminate user error.
[PAX-it] is the best system out in the Metallurgy and Materials Science world I ever used. I had to use another system made overseas when I was at my old company and never liked it. ...All diehard metallurgists like PAX-it!
- Fortune 500 Customer