
Image Measurement
The PAX-it Measurement Module is a quick and easy way to manage features on your images, with immediate results that are displayed on screen. Measurement data, data summaries, graphs, and the annotated images can be taken to written reports in MS-Word or MS-Excel with the click of a button.
With the PAX-it Measurement Module, the workflow is seamless from image capture to measurements to reporting. There is no need to export images to other programs or to cut and paste data, thanks to the integrated nature of the PAX-it software.
PAX-it Measurement Module Features:
- Point-to-point linear measurement.
- Regressed line measurements.
- Radius, diameter, area, and perimeter on ellipses and circles.
- Drawn circles, regressed circles, and circles by radius.
- Area, perimeter, and X/Y dimensions for rectangles.
- Total length of segmented lines, including segment lengths.
- Area and perimeter of irregular shapes, drawn freehand or by polygon.
- Manual “point counts” for tagging and summing events as they are clicked.
- Angle measurements, including length of lines.
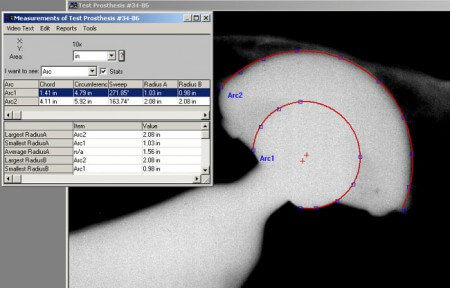
- Arc measurements including definition of center point, chord lengths, sweep angles, and radii.
- Parallel line calipers for defining multiple layers or zones.
Additional Features:
- PAX-it measurements are placed on the image as an annotation layer, which may be exported to reports, presentations, or files.
- Easy-to-use features include multiple levels of undo/redo, grouping, saving & reloading on new images, and more.
- Special “Measurement Tolerance Indicator” allows input of specs, to indicate if a measurement falls out of specifications.
- Built in calibration interface is easy to use.
- Images can be measured in microns, millimeters, centimeters, inches, pixels, feet, meters, and mils, and measurements units may be converted.
- Place a measurement scale bar as on overlay on the image.
- Extend or trim measurement lines relative to easily align them to other measurement objects.
- Measurement values may be stamped on images.
- Measurements are displayed in an on-screen table, including immediate statistics and graphs.
- Measurement information can be included in a report template created in Microsoft Word or Microsoft Excel. Reports can also include the marked up image.
- Measurements may be named by the user, and the names displayed on the image, in the summary table, and in reports.
- Measurement line sequences may be defined, for labs with repetitive multiple measurements. A tremendous timesaver!
- Auto-incrementing of measurement lines is available. For example, if a “Leg1” measurement is made, the next measurement line will automatically be titled “Leg2”.
- Measurement items may be drawn starting at the nearest, midpoint, center, endpoint, tangent, perpendicular or intersection of other measurement items.
- Color separation of 24 bit image into the red, green and blue planes
- Calibration log is maintained for reference.
[PAX-it] is the best system out in the Metallurgy and Materials Science world I ever used. I had to use another system made overseas when I was at my old company and never liked it. ...All diehard metallurgists like PAX-it!
- Fortune 500 Customer